
Your Images Are The Only Amazon Listing Optimization Tool That Matters
The Amazon seller community is obsessed with chasing keywords, a game of diminishing returns. Keywords get your product seen, but they don't get it sold.
Your images do.
Most sellers get this backward. They spend months tweaking backend search terms for a fractional bump in traffic while neglecting the single most powerful conversion asset on their listing. Your images are the primary lever for improving every metric that matters: click-through rate, conversion rate, and even PPC efficiency.
Stop Chasing Keywords. Start Optimizing Your Visuals.
The hierarchy is simple: images sell first, copy sells second. Focusing on keyword optimization while your images are mediocre is a critical strategic error. It's like buying a Super Bowl ad to promote a broken website—all traffic, no conversion.
The Conversion Hierarchy: Images First, Always
Consider the buyer's journey on Amazon. Your main image must earn the click from a search results page saturated with competitors. Its only job is to stop the scroll and secure that initial engagement.
Once on your product detail page, your secondary images take over. They must answer questions, neutralize objections, build trust, and drive the "Add to Cart" click. If your image stack fails at these two jobs, no amount of keyword optimization or PPC spend will save you.
Your image stack isn't a gallery; it's a visual sales pitch. Each image must serve a purpose—demonstrating scale, highlighting a critical feature, building trust through social proof, or showing the product in a relatable context. Neglecting this is like sending a salesperson into a meeting without a presentation.
When a customer lands on your page, their eyes go directly to the images. They scan them in seconds, long before they read a single bullet point. If your visuals don't instantly communicate value and answer their immediate questions, they bounce.
This "bounce" directly tanks your Unit Session Percentage—a critical ranking metric. For a deeper look at building visuals that drive this metric, our guide on creating research-driven Amazon listing images provides a complete framework.
Shifting Your Tool Evaluation Mindset
This guide reframes how you evaluate Amazon listing optimization tools. Stop searching for the next keyword finder. The only tools worth your investment are those that help you test, validate, and improve your visual assets.
The right tool doesn't spit out search terms; it provides hard data on which images convert shoppers into buyers.
The power of visuals is not a secret. The most successful ecommerce ad strategies are built on this principle: powerful images persuade people to buy. This is the mindset shift required to stop chasing algorithm trends and start building a high-converting, defensible brand on Amazon.
Define Your Visual Optimization Goals and KPIs Before You Buy
Buying a new tool feels productive, but without a clear target, it's just another line item on your P&L. Vague goals like "increase sales" are useless. They lead directly to bloated, expensive software that fails to solve your actual problem.
Before evaluating any software, you must define what success looks like. That means analyzing your own data to find where your listing is bleeding conversions.
Find the Bleed Before You Buy the Bandage
The first question is always: where are shoppers dropping off? Is your main image failing to get clicks from the search results page? Or are people clicking through, hitting your detail page, and then bouncing because your secondary images aren't closing the deal?
Don't guess. The answer is in your Amazon Business Reports. This is your baseline. The data tells a story if you know how to read it.
Focus on two core metrics directly tied to your images' performance:
Click-Through Rate (CTR): The purest measure of your main image's power, found in your advertising reports. High impressions with a low CTR means your main image is losing the battle for attention on the search page. It’s that simple.
Unit Session Percentage (CVR): Your conversion rate. High session volume with a low CVR is a massive red flag. It means your secondary images and A+ Content are failing. Shoppers are interested enough to click, but something on your page fails to convince them to buy.
Once you know which metric is dragging you down, you have your primary goal. Now you’re not just shopping for a tool; you're hiring one for a specific job.
A classic mistake is throwing money at an all-in-one tool without knowing which feature to use. If your CTR is in the gutter, you need a tool with robust main image A/B testing. If your CVR is the problem, you need features that help validate the clarity of your infographics or the appeal of your lifestyle shots.
Setting Actionable and Measurable Goals
With your weak point identified, you can set a crystal-clear objective. Any tool you consider must help you hit this number. Your goal must be specific, measurable, and directly connected to a visual element on your listing.
Strong, data-backed goals look like this:
Objective: Increase CTR on our top 5 keywords from 0.45% to 0.75% within 60 days by split-testing three new main image concepts.
Objective: Improve Unit Session Percentage from 8% to 11% by testing new infographic designs that address the top three customer complaints found in our product reviews.
Objective: Slash our return rate for "wrong size" by 15% by creating and validating a new sizing chart image through audience polling.
This clarity transforms your hunt for an "Amazon tool" into a precise mission with a measurable ROI.
For more on creating visuals that move these numbers, you can learn more about crafting research-driven Amazon images on our blog. With a clear goal in hand, you are now ready to build a checklist of features that will make a real difference.
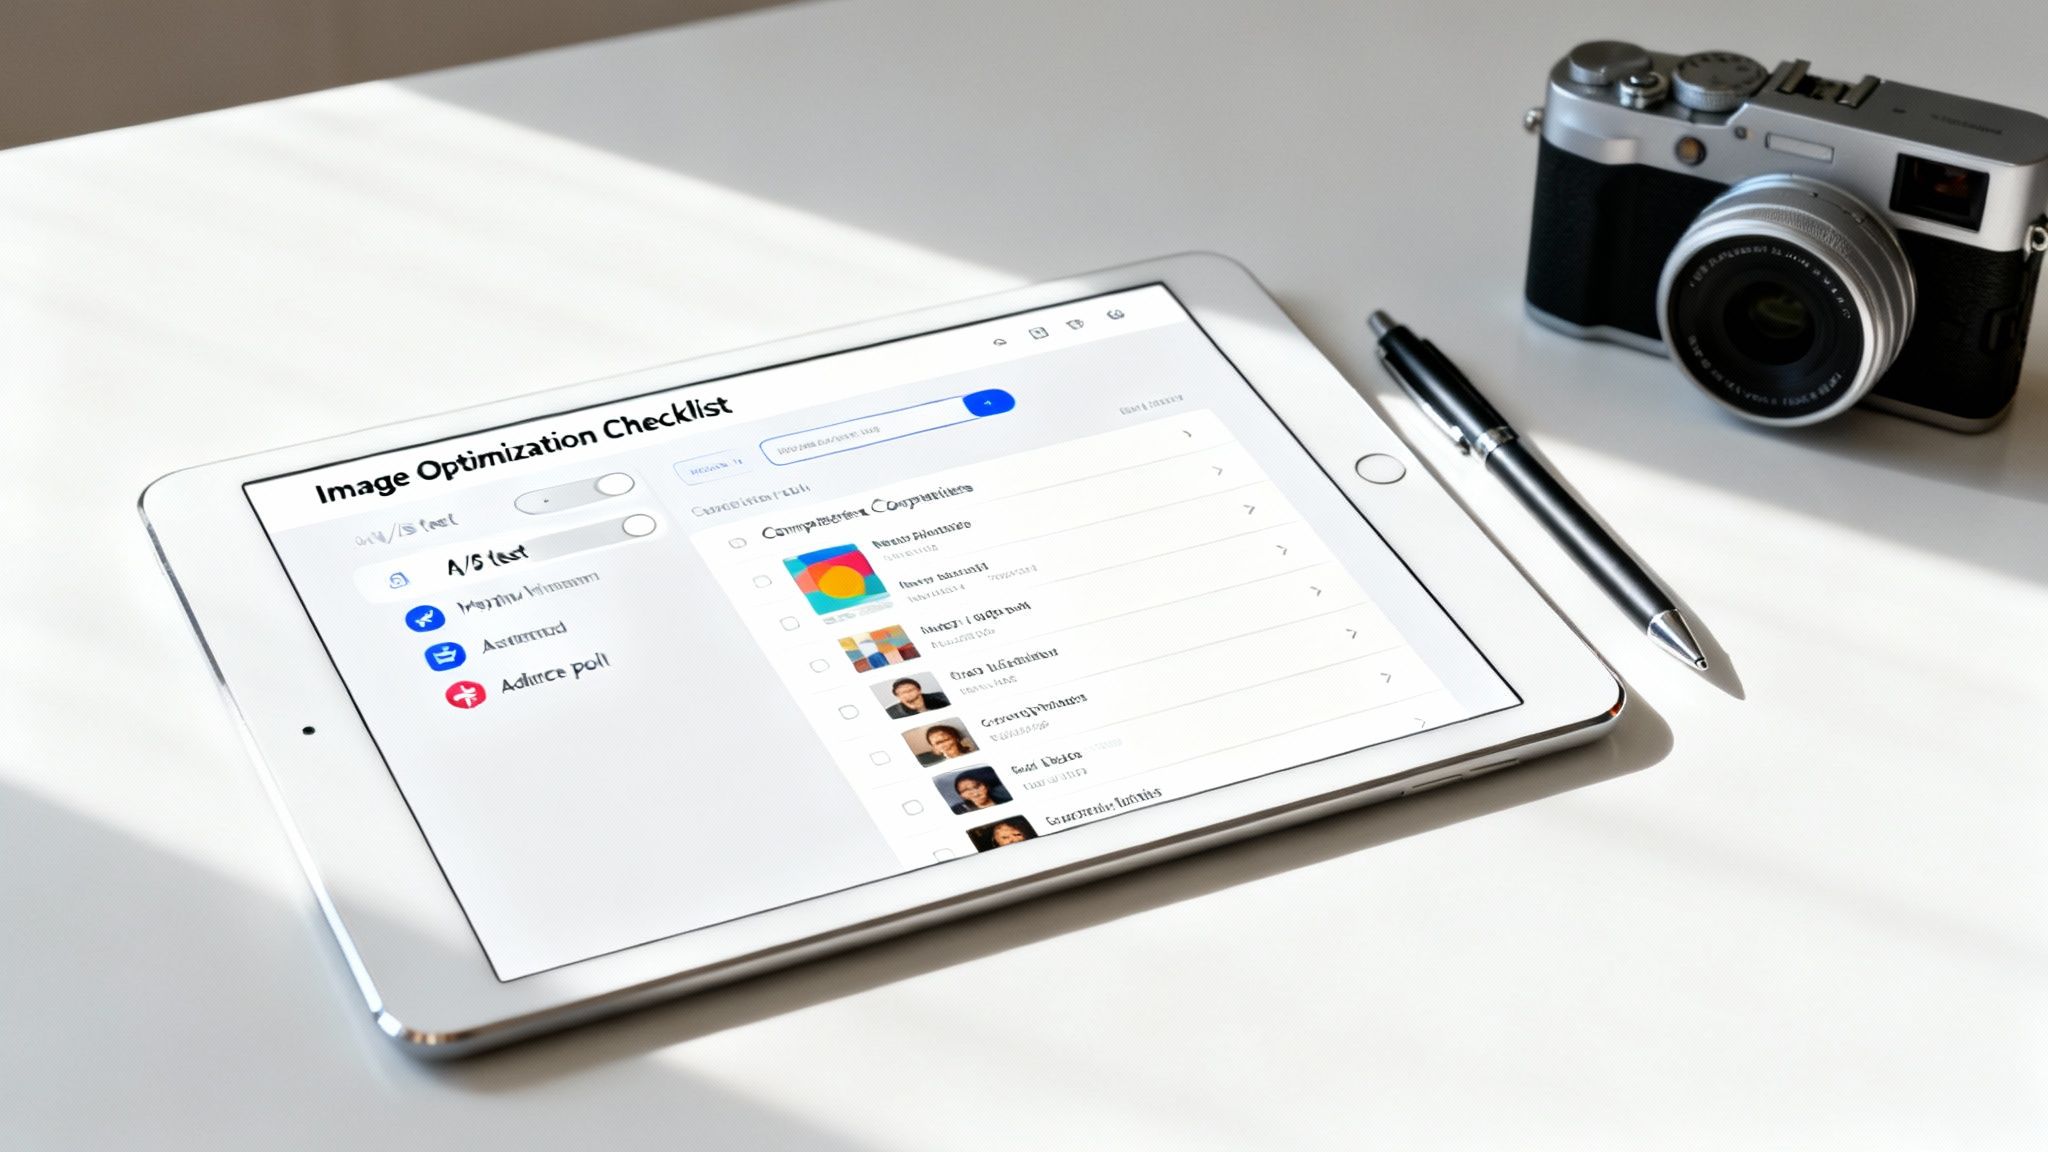
The Essential Feature Checklist for Image Optimization Tools
Most software pitched as an "Amazon listing optimization" tool is just a keyword research platform with bells and whistles. As a seller focused on what actually moves the needle—your images—you need a tool built for conversion, not just traffic.
This is about cutting through marketing fluff to find features that deliver a measurable lift in your click-through and conversion rates. Anything else is a distraction.
Core Functionality for Real CVR Impact
A true image optimization tool eliminates guesswork and provides hard data. It must be built around testing and validation, enabling decisions based on what shoppers actually do, not what you think they want.
Before considering a demo, ensure any potential software has these non-negotiable features:
Main Image A/B Split Testing: The absolute cornerstone. The tool must run controlled tests on your main image, serving different versions to shopper segments and measuring the real-world impact on CTR. Without this, you’re flying blind.
Competitor Image Analysis: The platform must allow systematic tracking and analysis of your top competitors' image strategies. This means monitoring their A+ Content, the types of secondary images they use (infographics, lifestyle shots), and any changes they make over time.
Audience Polling & Creative Validation: Getting feedback before an image goes live is a massive competitive advantage. Look for features that let you poll a target audience on different creative concepts. This validates which concept communicates value most effectively and dramatically reduces the risk of launching a visual that falls flat.
A common mistake is paying for a suite of features you'll never touch. You don’t need another keyword tracker. You need a specialized instrument designed to solve one specific problem: improving visual persuasion to lift your Unit Session Percentage.
Advanced Features for Deeper Insights
Once the basics are covered, look for advanced features that provide deeper psychological insights into shopper behavior. These are the tools that separate market leaders from the rest.
Heat Mapping & Click Tracking: This reveals exactly where shoppers look and click within your secondary images. Are they trying to zoom in on a specific feature? Is a particular lifestyle shot getting zero attention? This data is gold for refining your visual hierarchy.
Tagging and Categorization: Can the tool analyze and tag competitor images by type (e.g., "lifestyle with model," "feature callout," "comparison chart")? This allows you to spot visual trends and identify gaps in your own image strategy.
Integrated Performance Metrics: The tool must pull in relevant Amazon data, connecting your image tests directly to business outcomes. It should clearly show how a winning image variant impacted not just CTR, but also sessions, sales, and overall conversion rate.
To help you prioritize, here’s a breakdown of what’s essential versus what’s nice to have.
Essential vs. Optional Tool Features for Image CVR
| Feature Type | Essential (Must-Have) | Optional (Nice-to-Have) | Why It Matters |
|---|---|---|---|
| Testing Capability | A/B split testing for the main hero image. | A/B testing for secondary images or A+ Content. | The main image is the single biggest lever for CTR. Everything else is a secondary optimization. |
| Audience Feedback | Pre-launch audience polling for creative concepts. | Live surveys or on-page feedback widgets. | Validating your message before you spend on a full photoshoot or design saves time and money. |
| Competitive Intel | Tracking and analysis of top competitors' images. | Automated alerts for competitor image changes. | You need to know what visual strategies are working in your category to find your competitive edge. |
| Performance Data | Direct integration with Amazon sales and session data. | Predictive analytics or CVR forecasting. | Without connecting tests to actual sales and CVR data, you're just measuring clicks, not profit. |
| Visual Analysis | Heat maps or click tracking on secondary images. | AI-powered image "scoring" or suggestions. | Understanding where shoppers look and click tells you what they care about most. |
Focusing on the "Essential" column ensures you invest in a tool that solves the core problem of visual conversion. The "Optional" features are powerful but are not the foundation of a solid testing process.
Strategically optimized images are a high-leverage move. Listings with enhanced visual content like A+ Content can see a sales lift of up to 20%. For sellers in a crowded market, that's a massive edge. You can find more insights on how brands can win on Amazon by optimizing their listings at Ntooitive.com.
This checklist isn’t about finding the tool with the longest feature list. It’s about finding the one with the right features—those laser-focused on testing, validating, and improving the single most important asset on your product page.
How to Vet Vendors and Avoid Shelfware
Picking an optimization tool is a commitment of time and money. The right one is a force multiplier. The wrong one becomes expensive “shelfware”—another subscription gathering digital dust.
The goal isn't just to buy software; it's to find a strategic partner.
This means looking past the feature list and digging into the vendor's methodology and commitment to your success. Any salesperson can promise a CVR lift, but you must pin them down on the how and the why. A classic mistake is being wowed by a slick demo without questioning the data or logic behind it.
Asking the Right Questions
Before signing a contract, you need straight answers. Vague replies or marketing fluff are massive red flags.
Here’s what to ask:
Data Accuracy: Where does your data come from? How do you maintain accuracy and sync with Amazon's API?
Testing Methodology: Is this a true A/B split test or a multi-armed bandit setup? How do you ensure statistical significance and prevent test group contamination?
Support & Onboarding: What does setup entail? Who is my direct contact for strategy questions, not just tech support?
Proven Results: Show me case studies from brands in my category and of a similar size.
These questions cut through the sales pitch. You're looking for transparency and a logical process. Any talk of "guaranteed ranking" should have you running.
Shelfware happens when a tool's promise doesn't match its practical application. If the vendor can't clearly explain how their software fits into a real-world workflow to get measurable results, walk away. Your time is too valuable for a tool that creates more work than it saves.
Due Diligence Beyond the Demo
Your homework doesn't stop after the sales call. To properly vet a potential partner, you must do your own research. This means checking third-party review sites, talking to current users, and assessing the company’s reputation in the seller community.
A structured approach is your best defense. Using an ultimate vendor due diligence checklist provides a solid framework to ensure nothing critical is missed.
The right tool should feel like an extension of your team. Once you’ve chosen, the next step is to plug their insights directly into your creative workflow. For a deep dive on how to build images designed to convert from day one, see the ProductShots research-driven image creation process. Aligning your tools and creative this way ensures every dollar you spend delivers a direct, measurable return.
Integrating Your Optimization Tool with Your Image Workflow
Buying an optimization tool is easy. The real work is embedding it into your creative process so it doesn't become shelfware.
This isn't about letting software dictate your brand identity. It’s about using data to write a smarter creative brief. A good tool acts as the bridge between raw performance data and the design direction you give your team, killing guesswork before you spend a dime on photography or design.
This simple process flow shows how to vet a vendor to ensure they fit into your system.
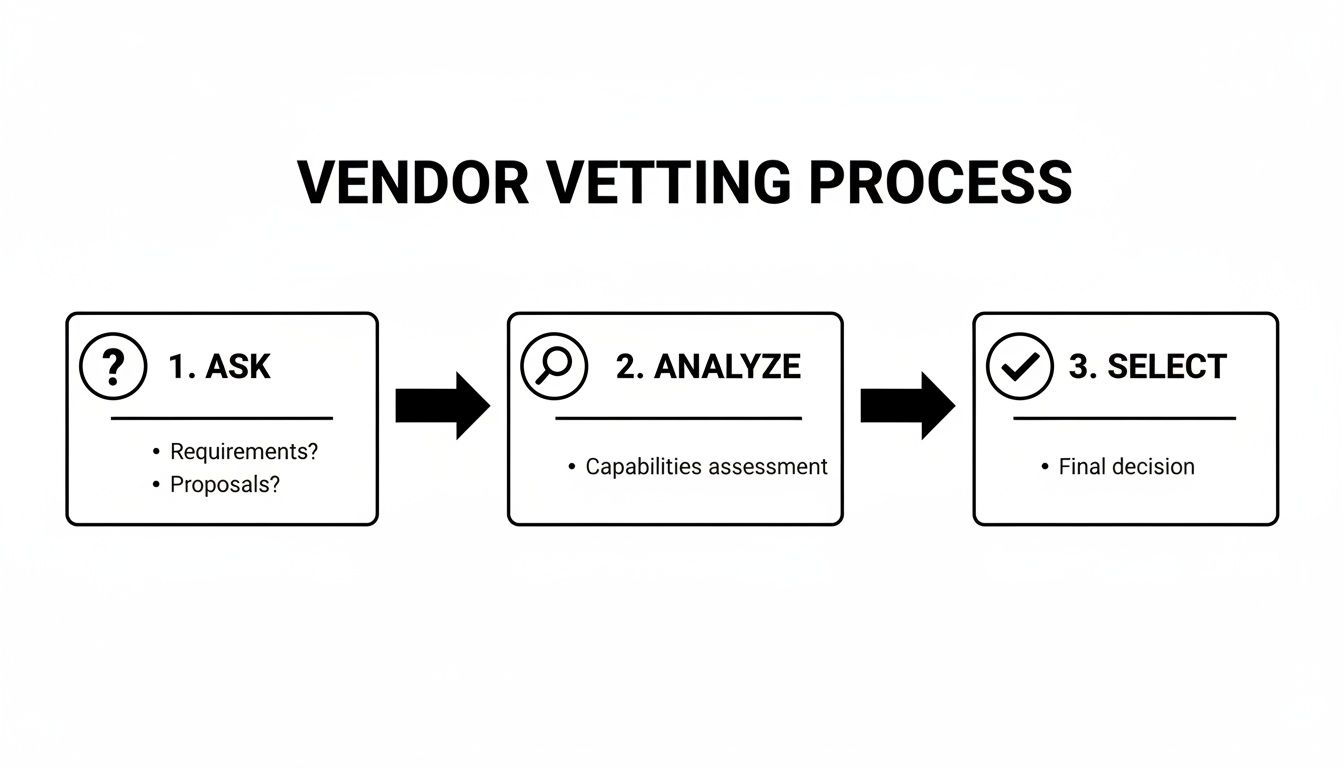
This Ask, Analyze, Select framework forces you to consider how a tool will integrate with your existing workflow, not just what features it has on a pricing page.
From Data to Design Hypotheses
Too many sellers view their tool's data as a report card. This is a mistake. Treat it as a blueprint for your next image set.
The goal is to build a system where every image is designed around a specific, testable hypothesis.
Here’s what that looks like in practice:
Competitor data guides the style. Your tool shows the top three competitors are succeeding with lifestyle images featuring a specific demographic. Your hypothesis: "A lifestyle shot showing our product used by that demographic will convert better than our current product-on-white image." This insight goes directly into the photographer's brief.
Audience polling validates concepts. You're debating two infographic angles—one highlighting "durability" and the other "ease of use." Instead of guessing, you run both concepts through your tool’s audience polling feature. The data shows "ease of use" is the winner. That concept goes into production; the other is shelved.
Heatmaps refine the layout. A heatmap of your current A+ Content reveals shoppers are ignoring a key feature callout. Your new design hypothesis: "By increasing the font size and adding a high-contrast icon to this feature, we can draw more attention and lift conversion." You now have a specific, data-backed visual change to test.
This approach flips image creation from a purely creative exercise into a strategic, data-driven operation. You stop burning money on visuals that might work and start investing in visuals that are pre-validated to hit specific conversion triggers.
The Rise of Integrated AI
This workflow is accelerating. By early 2026, over 900,000 Amazon sellers had already adopted generative AI tools. AI-generated suggestions saw a 90% acceptance rate and boosted listing quality scores by 40%. You can find the data on Amazon's AI listing tool adoption at Novadata.io.
As AI becomes more deeply integrated, the feedback loop between data analysis and creative execution will become nearly instantaneous.
This creates an unbreakable link between your optimization tools and what your creative team produces. For sellers wanting to track the real-world impact of these efforts on their bottom line, you can monitor your order status and performance metrics here.
The tool doesn't just measure your results; it actively helps shape the assets designed to produce them.
Your Images Are Your Highest-Leverage Asset
The best Amazon listing optimization tools are force multipliers. But they only work when pointed at the right target. Too many sellers obsess over keyword density and bid adjustments while ignoring the one asset that actually persuades shoppers: the product images.
Smart sellers win by systematically improving the visual experience that drives the buying decision.
Invest in a research-driven image strategy first. Then, use data-centric tools to validate and refine that strategy for maximum conversion. This approach ensures your marketing spend delivers a measurable ROI by targeting the purchase decision at its most critical point.
A Few Common Questions
What's the one feature an Amazon listing tool absolutely must have?
Without a doubt, A/B split testing for your main image.
Your main image is the single biggest lever you can pull to increase traffic. It’s what earns the click from a crowded search results page, directly controlling your Click-Through Rate (CTR). All other assets—copy, A+ Content, secondary images—are useless if shoppers don’t click in the first place.
Features like audience polling or competitor research are useful for generating ideas, but live A/B testing is the only way to know with certainty what real customers respond to. Anything else is an educated guess.
How soon will I see results after using one of these tools?
You can see shifts in leading metrics like CTR within days of launching a main image test.
However, for a statistically significant lift in your conversion rate (Unit Session Percentage), you need more time. It typically takes a few weeks to gather enough data to be confident in the results.
This timeline depends heavily on your listing's traffic volume. More traffic yields faster results. The biggest mistake is ending a test too early. Let it run until the tool declares a clear winner based on statistical significance, which can take anywhere from one week to a month.
Are these tools actually worth the money for smaller sellers?
Yes, provided you choose the right one.
Avoid massive, do-everything suites that cost a fortune. As a smaller seller, your best investment is a specialized tool focused purely on image and conversion testing. The cost is an investment, not an expense, because better images are a true force multiplier.
A better main image makes your PPC campaigns instantly more efficient by increasing CTR for the same ad spend. A better set of secondary images boosts your conversion rate, which directly improves your organic ranking. The ROI from even a small lift in conversion almost always pays for the tool subscription many times over.
Stop guessing and start building your listings with visuals proven to convert. ProductShots creates a complete, research-driven image stack for your listing in just 2-3 days, all designed to crush buyer objections and drive sales. Get your professionally designed listing images today.